Before you start
This guide assumes you already know the basics of the FlowDeck TUI. If flowdeck -i, R to run, ? for help, and the four-region layout (header, project info, Build/Run/Test card, status bar) don't ring a bell, start with the getting-started guide. It covers install, first-time setup, and the day-to-day build / run / test loop.
By the end of this one you'll have used the TUI's log viewer, test runner, settings pickers, and simulator manager, the surfaces that turn the TUI from "nice for builds" into a complete terminal IDE.
Step 01
Stream the app's logs
With the app running (you pressed R and the status bar reads Running), press L to open the log viewer. The view shows only the running app's output, filtered automatically by app ID. No SpringBoard noise, no other process noise.
L only does something when there's a running app to stream from. If you press it before R the TUI won't have an app to attach to.
![The FlowDeck TUI log viewer. The top bar shows the bundle ID co.danielbernal.WeatherApp with the 8-character app ID A9489137 on the left, and Logs plus a line counter 122/122 on the right. The body streams structured log lines tagged with categories like [ViewModel], [WeatherAPI], [UI], and [Search]. The bottom bar shows a Filter input and key hints: ↑/↓ Scroll, PgUp/PgDn Scroll, ESC Exit.](/assets/images/guides/tui/05-logs.png)
What's on screen:
- Top bar, the app's bundle identifier and 8-character app ID (FlowDeck's internal handle for the running instance), plus a
lines / totalcounter that ticks up as the app emits more output. - Body, every
print(),OSLog, andos_logcall from the app, in order. Subsystem and category tags fromOSLogrender inline. - Bottom bar, a filter input and the live key hints.
Useful keys inside the log viewer:
- Start typing, populates the
Filter:input. The view filters in place to lines matching the substring. - ↑ / ↓, scroll one line at a time through history.
- PgUp / PgDn, scroll a page at a time.
- Esc, exit the log view; streaming continues in the background. Press L again to come back, scroll buffer preserved.
Step 02
Run tests from the TUI
Press T to launch the current scheme's test target. The TUI streams per-test results into a viewer, grouped by suite, with live pass/fail counters at the top.
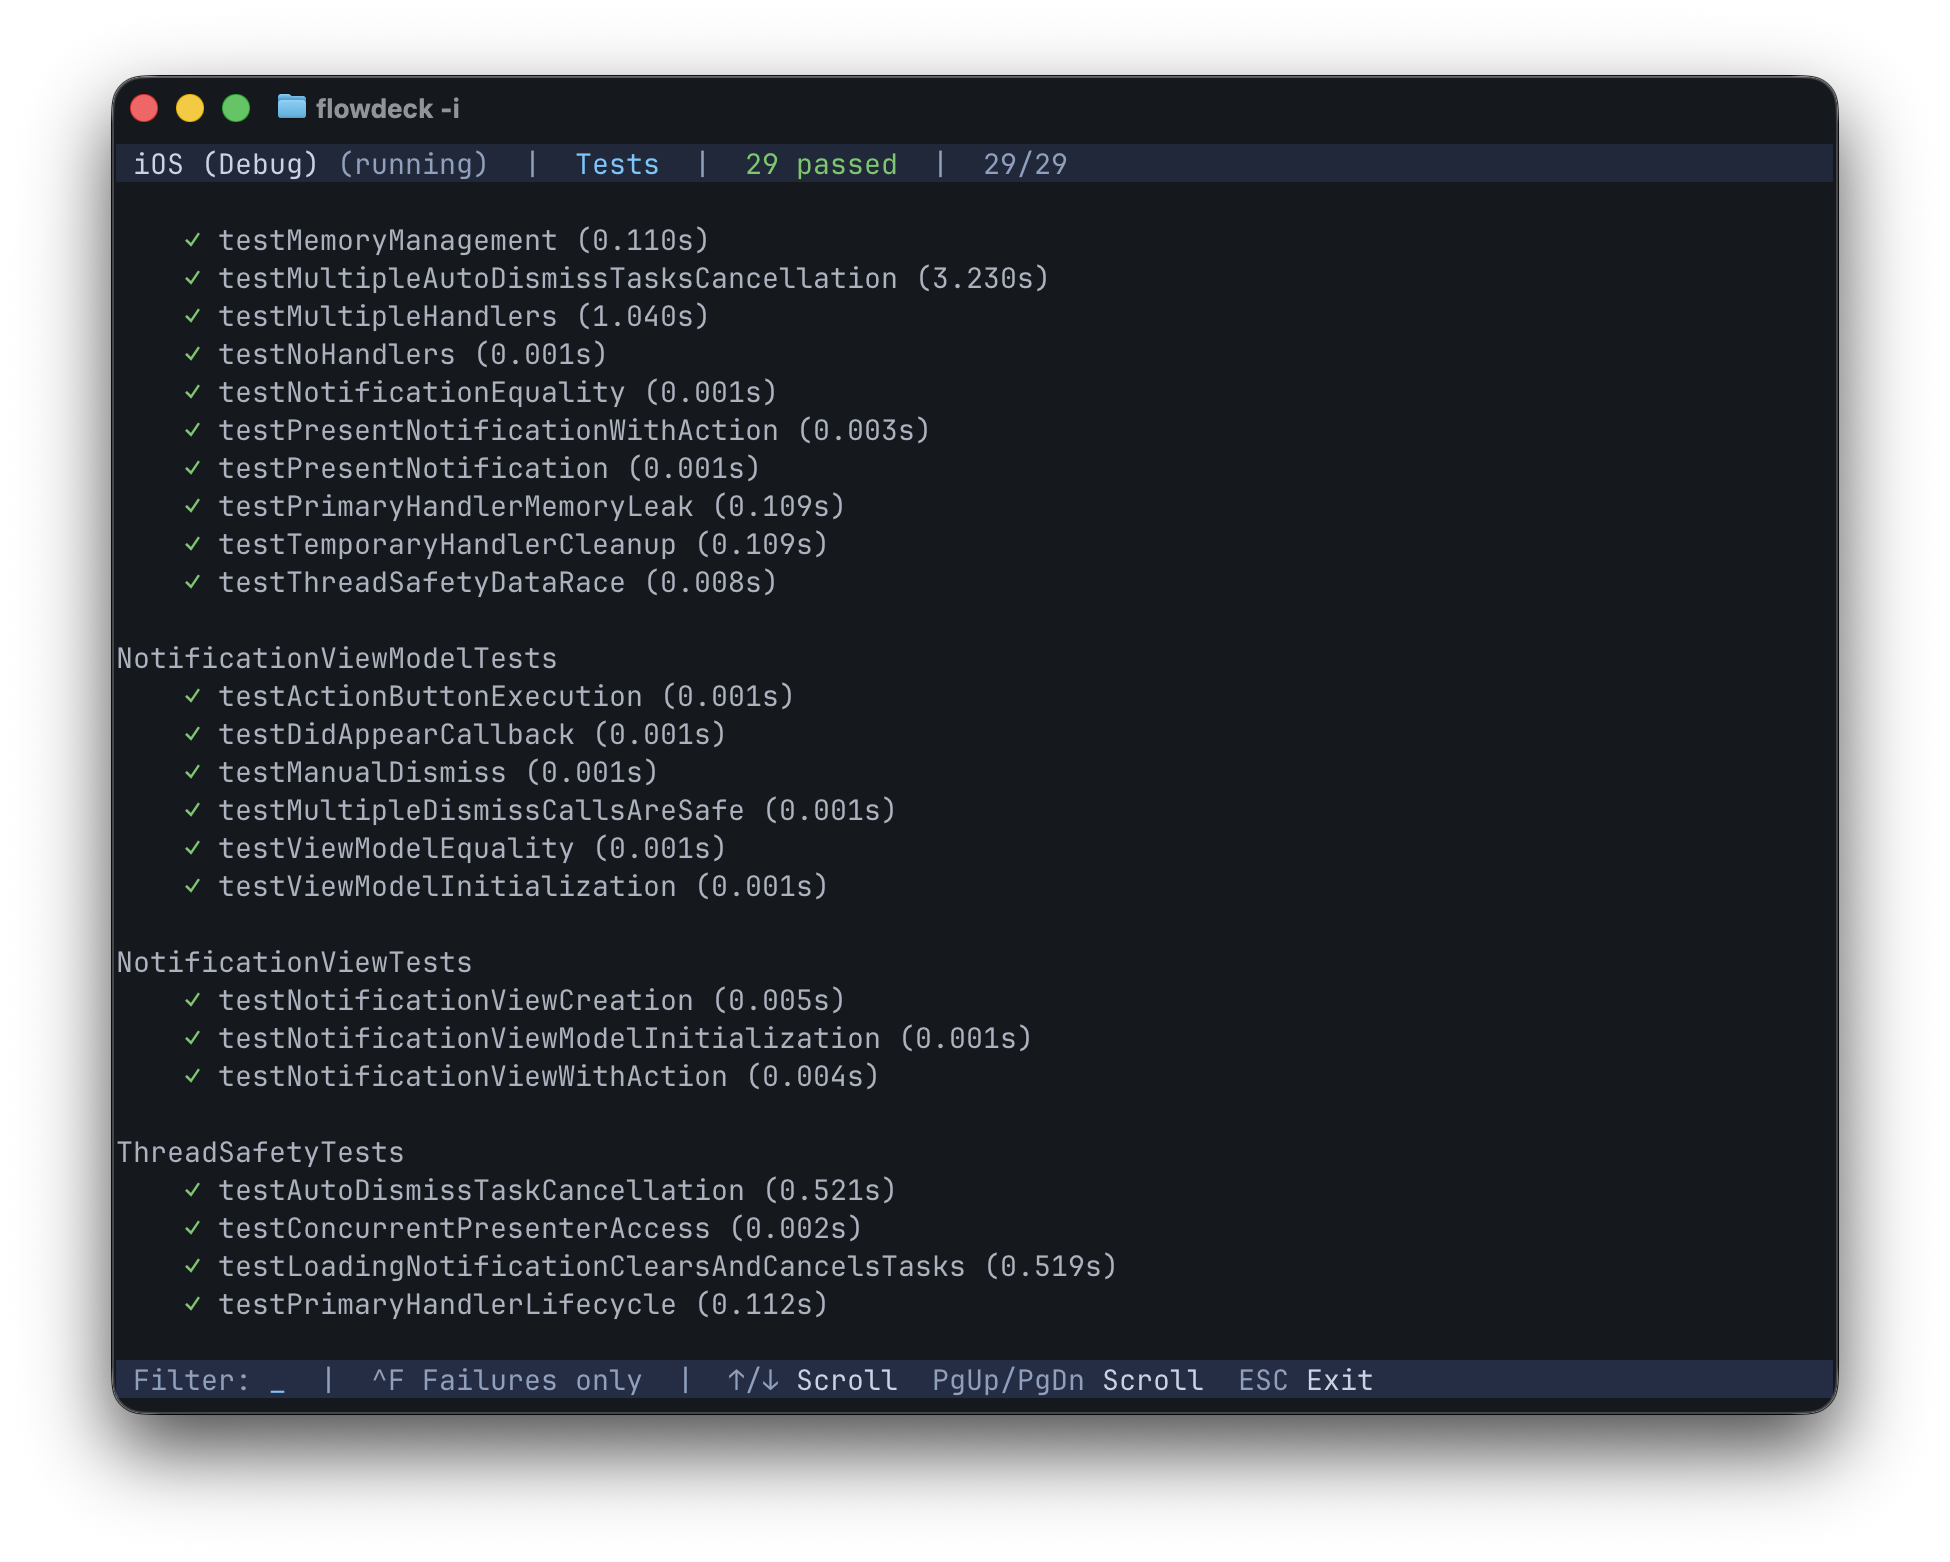
NotificationViewModelTests, NotificationViewTests, etc.) with the method name and duration on each row.What's on screen:
- Top bar, scheme + configuration, the live running state, pass count, and total count (
29/29means 29 tests have completed out of 29 expected). - Body, tests grouped by suite. The suite name renders as a header; each test below it shows a status glyph (
✓passed,✗failed,⏭skipped), the test method name, and the duration. - Bottom bar, filter input and key hints.
Useful keys inside the test viewer:
- Start typing, populates the
Filter:input. The view filters in place to suites and methods matching the substring. - Ctrl+F, toggle "Failures only" to hide passing tests when triaging a red run.
- ↑ / ↓, scroll one row at a time.
- PgUp / PgDn, scroll a page at a time.
- Esc, exit the test viewer. Streaming continues in the background; press T again to come back to it.
Test discovery is AST-based, the TUI doesn't need a build to know what tests exist. The same data is also available from the command line via flowdeck test discover --json if you want to filter targeted runs from scripts.
Step 03
Change build settings on the fly
You don't have to leave the TUI to switch what you're targeting. Four single-key shortcuts open the matching picker:
- S, Scheme. Pick a scheme from the workspace.
- D, Device / Simulator. Pick a target. The list shows both installed simulators and paired physical devices.
- G, Build Config. Switch between Debug, Release, and any custom configurations defined in your project.
- W, Workspace / Project. For directories with multiple workspaces or projects, pick the one to drive.
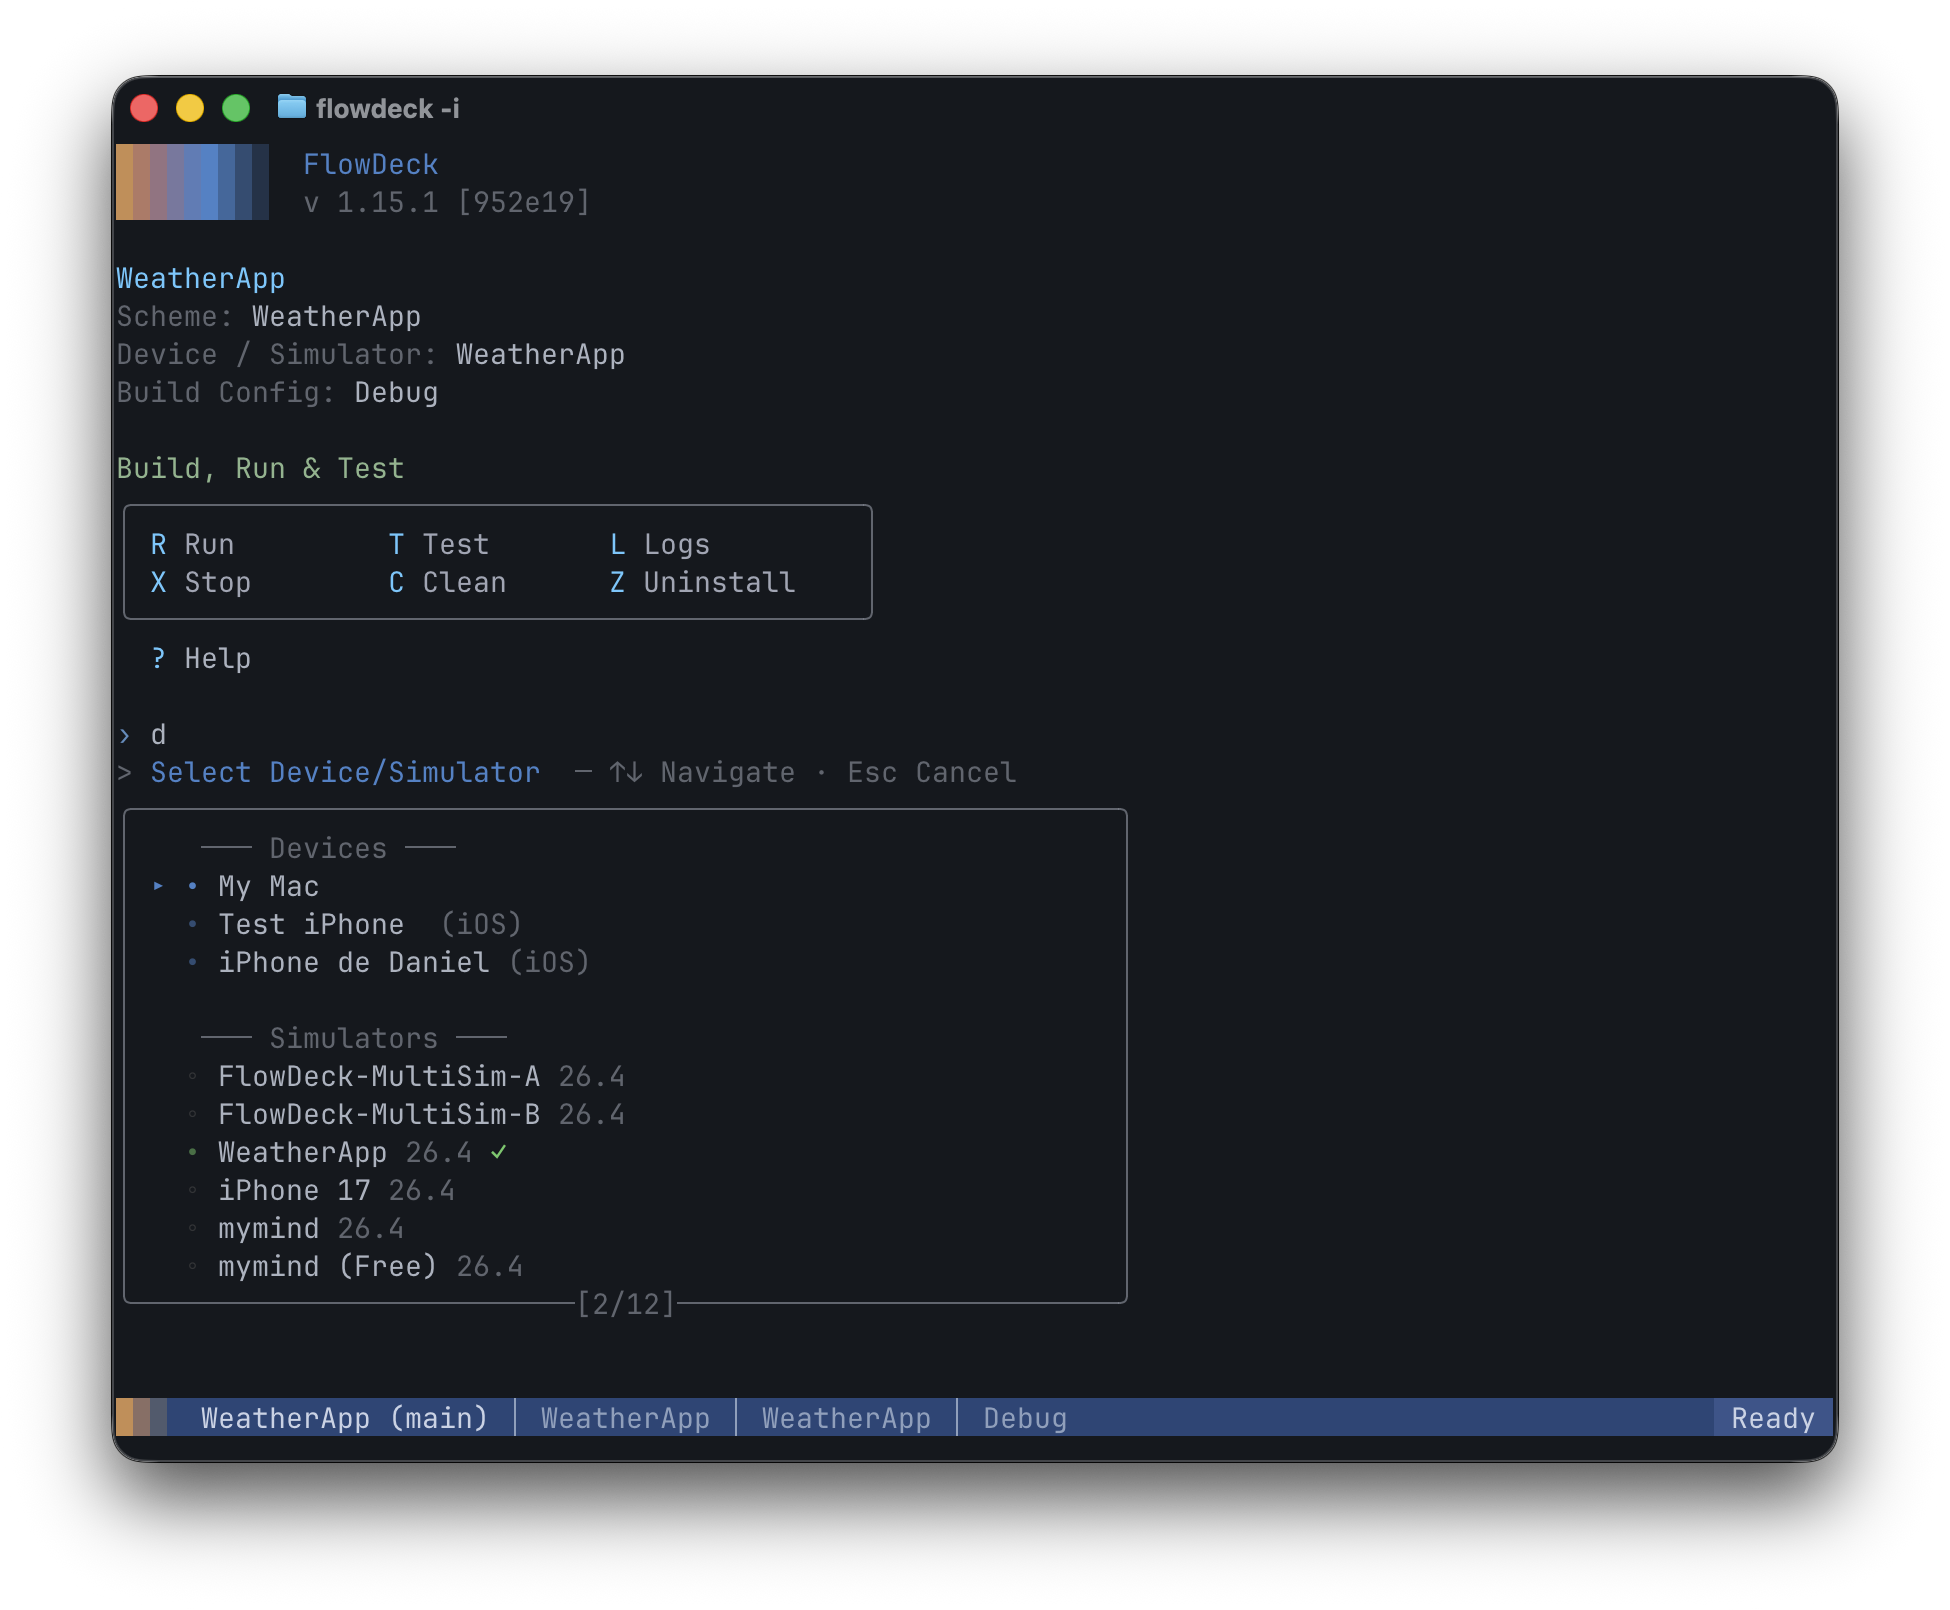
✓); the footer shows a paginator. S, G, and W pickers follow the same shape.Inside any picker:
- Arrow keys navigate within and across the sections.
- The current selection is marked with a check (
✓). - Enter confirms a new selection; Esc cancels.
Selections persist in .flowdeck/config.json in your project root. The bottom status bar reflects the new selection immediately. The next R or B uses it.
Step 04
Manage simulators and runtimes
Press E to open Devices, Simulators & Runtimes. The top of the view is a short action menu; drilling into an action opens a guided sub-flow.
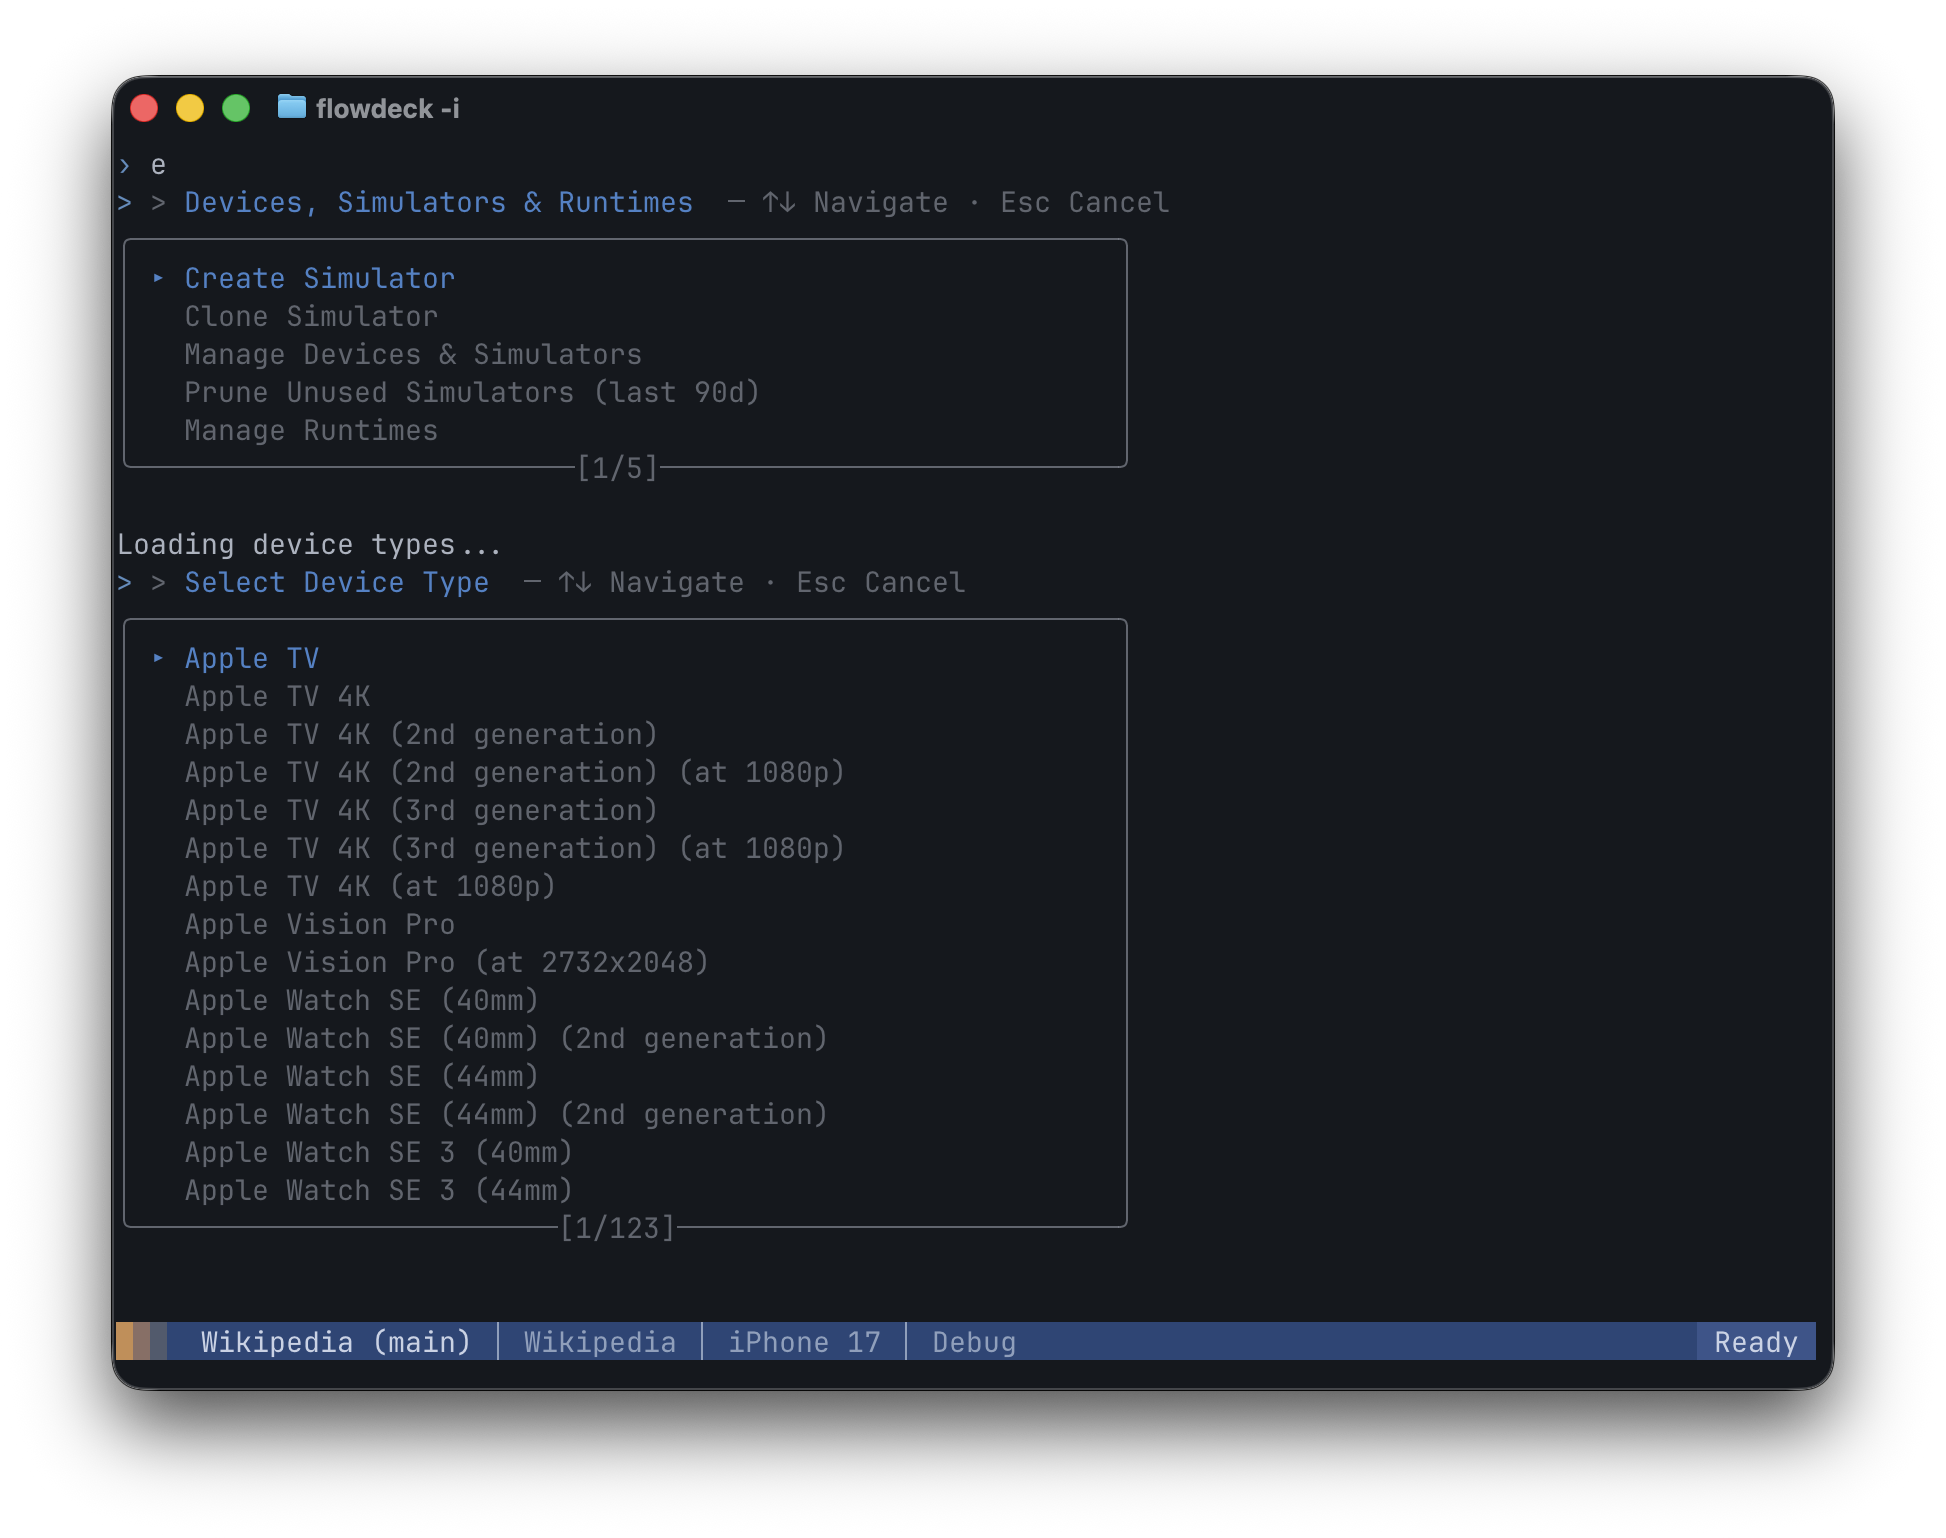
The top-level actions:
- Create Simulator, guided flow to create a new simulator. Pick the device type (Apple TV, Apple Watch, iPhone, iPad, Apple Vision Pro, etc.), then the runtime version.
- Clone Simulator, duplicate an existing simulator (state, installed apps, settings) for sandboxed test runs.
- Manage Devices & Simulators, list installed simulators with state (Booted, Shutdown), boot, shutdown, erase, or delete them.
- Prune Unused Simulators (last 90d), bulk-delete simulators you haven't booted in 90 days. Quick way to reclaim disk space.
- Manage Runtimes, install missing iOS, tvOS, watchOS, or visionOS runtimes from Apple's catalog. FlowDeck fetches and shows progress.
The same operations are available from the CLI (flowdeck simulator create, flowdeck simulator runtime install, etc.); the TUI wraps them in a navigable view.
Patterns that make the TUI worth opening
- Toggle L mid-repro to inspect the timeline.
- The TUI keeps the log stream alive in the background once you've opened it. Reproduce the bug in the running app, switch to the TUI, press L, and scroll back through exactly what the app emitted in order.
- Use the test view as a project's table of contents.
- For an unfamiliar codebase, pressing T shows every test organized by target and class. Even without running them, the tree tells you what behavior the team considered worth verifying. Combine with the filter input to slice by feature.
- Filter failures with Ctrl+F in a red run.
- The test viewer's "Failures only" toggle is the right view for triage. Hide passing tests, focus on what broke, fix, re-run. Failed tests render with a red
✗glyph and an expanded one-line failure message inline. - Switch destinations without exiting.
- S / D / G / W open the matching picker over the main view. Leave the picker, the status bar reflects the new selection immediately. No need to relaunch the TUI to change scheme, target, configuration, or workspace.
- Use ? when you forget a shortcut.
- The help menu lists every available shortcut grouped by function (Build/Run/Test, Build Settings, Tools & Settings). No reason to memorize them, the menu is one keystroke away.
When things go wrong
- The TUI looks garbled or characters render as boxes
- Your terminal isn't handling UTF-8 box-drawing characters or 256-color output. Switch to iTerm2, Warp, Ghostty, or modern Terminal.app. If you must use a basic terminal, set
TERM=xterm-256colorin your shell before launching. - Single-key shortcuts don't fire
- Usually a terminal multiplexer (tmux, screen) intercepting the keys. Either run the TUI outside the multiplexer or rebind the conflicting prefix. The TUI deliberately uses simple letter keys; there's no way to remap them around a multiplexer.
- Status bar shows the wrong scheme or simulator
- You changed
.flowdeck/config.jsonfrom another terminal and this TUI session didn't pick it up. Press S, D, or G to re-select, or Q and relaunch the TUI to refresh from disk. - Logs appear empty after pressing L
- Either the app already exited (status bar will show it), or it's running in a Release build where debug-level logging is filtered out. Press G to switch to Debug, then R to re-run.
- I want to quit and the keys don't respond
- Press Q. If a command is mid-flight and not responding (a stuck simulator boot, for example), press Esc to interrupt, then Q to exit.
Annex
Full keyboard reference
For reference, every shortcut available in the TUI, grouped by function. Press ? inside the TUI to see the same list.
| Group | Key | Action |
|---|---|---|
| Build, Run & Test | R | Run |
| T | Test | |
| L | Logs | |
| X | Stop | |
| C | Clean | |
| Z | Uninstall | |
| B | Build without running | |
| ⇧R | Run without building | |
| Build Settings | S | Scheme |
| D | Device / Simulator | |
| G | Build Config | |
| W | Workspace / Project | |
| Tools & Settings | E | Devices, Simulators & Runtimes |
| P | Project Tools | |
| A | AI Settings | |
| F | FlowDeck Settings | |
| H | Support | |
| V | Version | |
| ? | Help | |
| Q | Quit |
Every shortcut maps to a flowdeck CLI command; you can mix the TUI for interactive work and the CLI for scripting against the same project. State persists in .flowdeck/config.json.
Read next
Further reading
- Getting started with FlowDeck, the basics if you skipped them: install, first-time setup, and the day-to-day build / run / test loop.
- Things to ask your AI agent, the agent flows that run on top of the same FlowDeck commands.
- Automate iOS builds for CI, translate the TUI workflow into a CI job.
- Interactive mode reference, every shortcut and view in the FlowDeck docs.